|
What is a linear function?
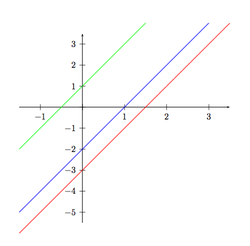
A statement that a first-degree polynomial—that is, the sum of a set of terms, each of which is the product of a constant and the first power of a variable—is equal to a constant. Specifically, a linear equation in n variables is of the forma0 + a1x1 + … + anxn = c, in which x1, …, xn are variables, the coefficients a0, …,an are constants, and c is a constant. If there is more than one variable, the equation may be linear in some variables and not in the others. Thus, the equation x + y = 3 is linear in both x and y, whereas x + y2 = 0 is linear in x but not in y. Any equation of two variables, linear in each, represents a straight line in Cartesian coordinates; if the constant term c = 0, the line passes through the origin. Fun Fact about linear functions:
|
Linear Equations in the Real World
Linear functions can be used in the real world in several ways. This video will give you an example scenario of when to use linear equations and graphs.
Properties of Linear Functions:
|
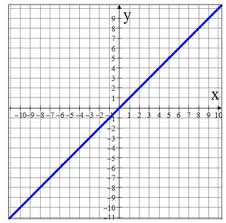
Linear Graphs and EquationA linear function is a function whose graph creates a straight line. Any continuous line, besides a completely vertical line, is a linear function. Linear function graphs have either a positive or negative slope, meaning they either decrease from left to right or increase from left to right. The equation for a linear function is always a 1st degree polynomial. some examples of those are:
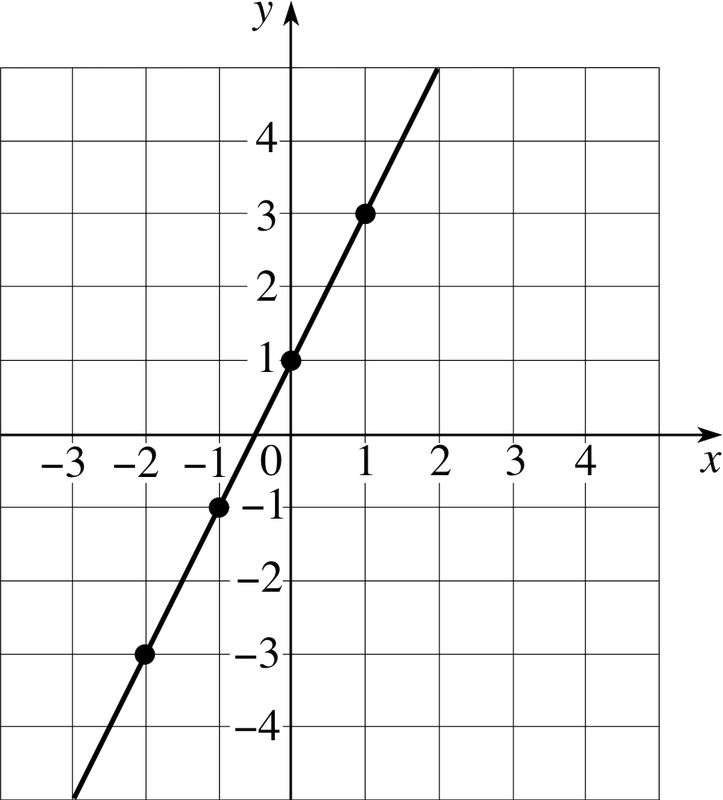
x+3y=7 2x-5y+8=0 x=-2 Linear functions, like all other functions, are subject to horizontal and vertical shifts from the parent graph. For example, the parent graph of a linear function is shown above. Now, given a linear equation of y=2x+1, we have a new y-intercept of 1, and a slope of 2 (using the form y=mx+b, where m=slope and b=y-intercept). Finally, our new graph should look like this: |

Common Core StandardsThe North Carolina Common Core says that students must be able to:
1. Distinguish between situations that can be modeled with linear functions and with exponential functions
3. Observe using graphs and tables that a quantity increasing exponentially eventually exceeds a quantity increasing linearly, quadratically, or (more generally) as a polynomial function. With this knowledge, students will be able to recognize different functions, like linear, and when to use them to solve problems. To learn more, click the link below. |
Examples
Real World situationSarah already owns 2 necklaces, and additional necklaces are priced at 2 for a dollar. Write an equation that shows the relationship between the money spent on additional necklaces dand the total number of necklaces n.
First, make a chart. 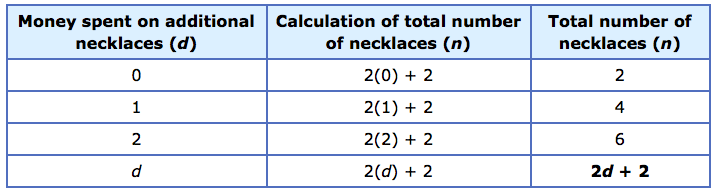
Next find the pattern:
n is 2 times d, plus 2. Then write this relationship as a pattern: n=2d+2 |
Mathematical SituationGiven the following table for a linear equation f(x), complete the table by filling in the missing data.
x y 1 5 - 7 3 - 4 9 5 - f is a linear function whose equation is f(x)=mx+b where m and b are constants. We are given the ordered pain (1,5) and (4,9). we can find a new equation by plugging them into x and y 5= m(1)+b and 9=m(4)+b Solving the first equation, m=5-b. When we plug that solution into the second equation for m, we get: 9=(5-b)(4)+b After solving this problem algebraically, we get b=3.666667 (3.7). Then we can go back to our first equation and solve for m. 5=m(1)+3.7 After solving this equation algebraically, we get that m=1.3. Now that we have our slope (m) and y intercept (b), we can write an equation for the data table. y=1.3x + 3.7 Now we go back to our data table and plug in each given value for the ordered pairs with a missing variable. (---, 7)so we know y=7 7=1.3x + 3.7 x= 2.5 (3, ---) so we know x=3 y=1.3(3) + 3.7 y=7.6 (5, ----) so we know x=5 y=1.3(5) + 3.7 y= 10.2 Lastly, we complete our data table: x y 1 5 2.5 7 3 7.6 4 9 5 10.2 |
